What is an audiogram?
After the complete hearing test, the audiologist will explain the results to you using an audiogram. So what is an audiogram?
It is a graph on which the audiologist illustrates your hearing ability. For each sound and frequency heard in the soundproof room, the professional indicates your hearing threshold, that is, the lowest and quietest sounds you can hear.
The audiologist uses these results to identify hearing loss and the degree of hearing loss. Hearing acuity between 0 and 25 dB is considered normal.
What does an audiogram show exactly?
When the audiologist presents the results, you will see two curves plotted on the graph—one for each ear.
The horizontal axis, going from left to right, depicts the sounds from low to high pitch, like the keys on a piano. These sound frequencies are measured in Hertz (Hz).
The vertical axis shows the volume (sound intensity), expressed in decibels (dB). The sounds near the top of the axis are weaker, and those near the bottom are louder.
Results in the grey area at the top of the graphs denote normal hearing. Anything falling in the white area indicates hearing loss. The more results there are in the bottom of the graph, the greater the loss of hearing.
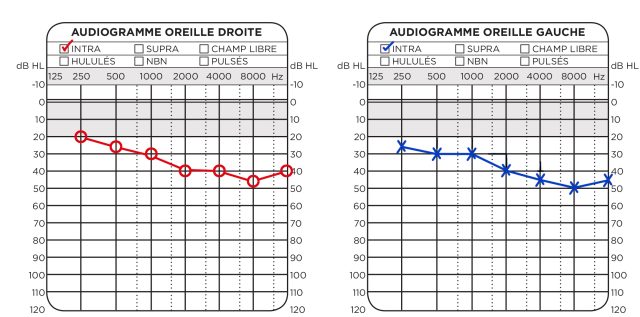
What do the Xs and Os on the audiogram mean?
The audiologist indicates your hearing threshold for each intensity and frequency using an X (symbol for the left ear) and an O (for the right ear). There may also be small dots used to depict results from a past hearing test.
What else does the audiogram show?
The professional might also assess how well your inner ears are working. These results are shown with checkmarks. Instead of wearing headphones as in the usual hearing test, this exam is done with a bone conduction vibrator that is placed against your skull.
These are just brief explanations. Your audiologist will provide more details about your specific results and will be able to answer all your questions.